Thursday, January 26, 2017

Security: Authentication and Authorization

There are two types of security in OBIEE:
1) Authentication
2) Authorization


Authentication

  • Authentication is a process in which system verifies a user for its valid credentials. Generally it verifies the Username and password of a user to make sure that the user has sufficient privileges to enter the system.
  • Oracle BI server authenticates the user.
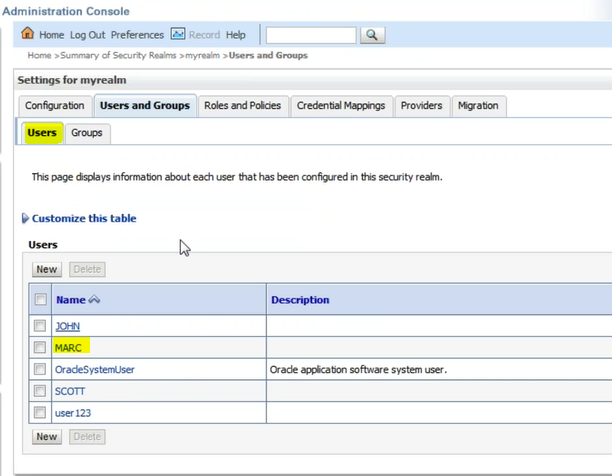
  • Console is the place where we create users http://localhost:7001/console. Login using Administrator privileges.
  • On left hand side under Domain structure --> Security realms --> myrealm --> Users & groups tab--> User sub-tab--> New -->
    • Name: BI101USER1
    • Password: welcome1
    • Confirm password: welcome1
  • click on ok, the user gets created.
  • Since this is created by Administrator, BI101USER1 is a valid user.
  • To authenticate a user, Oracle BI server uses following 2 technologies:
    • LDAP : OBIEE 11g has LDAP integrated with it already. LDAP stands for Lightweight directory access protocol.
    • External table


Authorization

  • Once a valid user logs into the system, what can be accessed by him is controlled by Authorization process.
  • Authorization is enforced in following two ways:
    • Object level
    • Data level or Row level

  • Since the valid user is created but no group is assigned to it, thus when we login to Analytics using BI101USER1, we do not see access to analysis, dashboard, prompt or any such OBIEE objects. 
  • In order to grant the access, we need to assign use BI101UER1 to the BIAythor group. To do this, go to console--> double click on BI101USER1, go to Groups sub-tab and assign BIAuthor group to BI101USER1 and save it.
  • Now we can go to Analytics --> reload server metadata -->sign out Administrator user. 
  • Restart the BI Presentation server as shown below so that the changes get reflected.


  • Now sign in as BI101USER1. All the OBIEE objects are accessible now. This is how to authorize a valid user to access OBIEE objects.


Object level Security:

This is further divided into 2 kinds since we have 2 kinds of objects:
  • Repository level
    • Subject area
    • Presentation tables
    • Their columns
    • Hierarchy object
  • Presentation catalog level
    • Reports
    • Dashboards
    • KPIs
    • Scorecards
    • Filters
    • Prompts
In order to implement Authorization, we need to consider each of the object mentioned above.

1) Repository level
  • For implementing authorization to any object in Repository, open it in Online mode.
  • Now doubles click the object of interest e.g. Sales subject area, Customers table, Revenue column etc.
SUBJECT AREA
  • For Subject area, double click on Sales subject area-->Check out-->
  • Go to General tab--> permissions-->
  • There will a list of users mentioned, if you do not see BI101USER1 then  got to "set online user filter"--> click * -->hit enter ---> select BI101USER1 --->ok. Now you will see this user in the list as shown below: Give appropriate READ/WRITE/NO ACCESS/DEFAULT access.

     
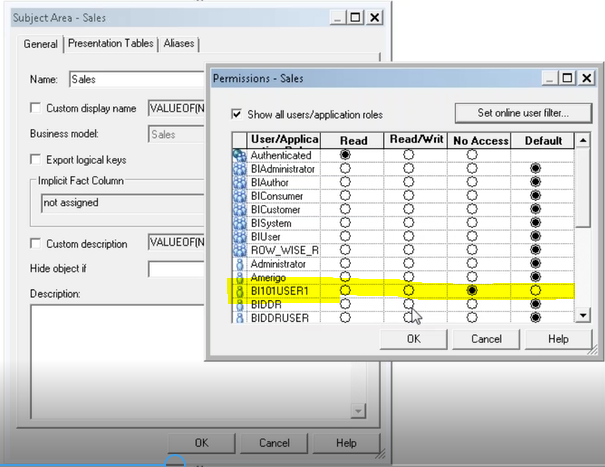
  • If we give no access, then BI101USER1 will not be able to see Sales subject area in Analytics.
  • Check-in changes and save.
PRESENTATION TABLE/COLUMN/HEIRARCHY
  • Select any table of interest say Customers.
  • Double click on Customers table -->check out-->general tab--> permissions button-->
  • For BI101USER1 click on no-access --> ok-->ok.
  • Check in changes & save.
  • Now loging to Analytics using Administrator user and reload server metadata.
  • Now login using BI101USER1 , the customer table will not be available.
  • 34:02
2) Presentation catalog level
  • Go to Analytics and log in with Administrator user.
Report
  • Go to Catalog and select any report of interest e.g. Agent Report
  • Click on More--> Permissions-->
     

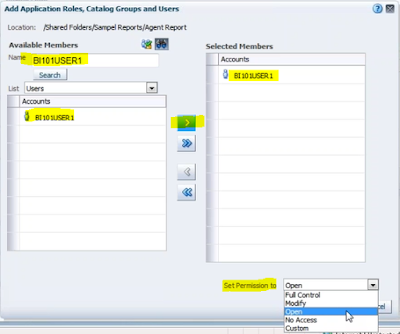
  • Click on green plus button and add BI101USER1 to the users list.
     

  • If we select No access, then BI101USER1 will not see Agent report next time he logs in.
    • Open: Open the Report but no edit access
    • Modify: Open , Read and write, Traverse access
    • Full control:  Open , Read and write , traverse (Navigating from one report to other report )access
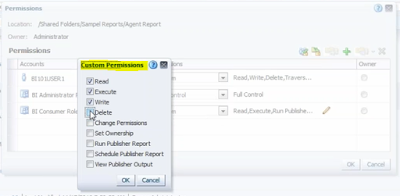
    • Custom: The permissions can be selected from a list as shown below:
       

  • Difference between Modify and Full control is that Full control allows to provide access to other users. 55:05

Dashboards

  • Login to Analytics using Administrator user -->Catalog-->Click on expand under Dashboards-->Click on more in any saved Dashboard of interest like "OBIEE Dashboard"-->Permissions--->Add BI101USER1--> set  permission to ---> Open/Read/Write/Traverse/No access/Full control etc -->ok-->ok.
  • Now sign out and login using BI101USER1 and open the catalog-->dashboard. If we provide no access then "OBIEE Dashboard" can not be seen in the catalog.


Dashboard Page

  • Login to Analytics using Administrator user -->Catalog-->Click on expand under Dashboards-->Double click and open any saved Dashboard of interest like "OBIEE Dashboard"-->Go to any page of interest like "PV Page"--> On right hand side click on Edit dashboard button--> Dashboard properties> Select PV page-->click on permissions as shown below:


  • Add BI101USER1 using green plus button as shown below:


  • Click ok--ok-->Save the OBIEE dashboard.
  • Login using BI101USER1 and go to catalog, double click and open the OBIEE dashboard--> No PV page can be seen.
  • This is how we restrict the BI101USER1 from viewing the dashboard page.


Tuesday, January 17, 2017

Time Series Functions

Time Series Functions
These are the set of functions that use time as its measure to calculate the performance of the business by comparing historical data to the current data.

Three standard types of Time series functions:
1) Ago :- For finding the revenue a month/week/year ago.
2) ToDate :- For finding the revenue from a particular date till today.
3) Period Rolling :- For finding revenue from 1 point to other point in time


 Steps to Implement time series functions:


1) Identify time dimension

  • In this step, we will identify a dimension table that has time related columns in it.Among all the dimension in BMM layer, Period is a dimension that shows us time related columns. Thus we identify Period Dimension as our time dimension as shown below:


  • Now double click on PeriodsDim-->Go to General tab--> check Time box under structure as shown below to make PeriodsDim our identified Time dimension:


   2) Identify Chronological keys
  • Right click on PeriodsDim and expand all as shown below

     
  • Now double click and open Year, select the checkbox for Chronological key as shown below:


  •  Similarly, make Quarter a chronological key at Quarter level, Make Monthcode as Chronological key at month level, Make YYYYMMDD a chronological key at day level.
  • This is how to define chronological keys.
3) Create Ago measurable column
  • Since all the measurable columns belong to Orders fact table, we will create AGO measurable column under ORDERS fact table. Say, if we want to measure revenue a month ago. 
  • To do this, Go to Orders-->New Object--> Logical column--> check out--> General tab --> Name: Month Ago --> Column source tab --> select the radio button "Derived from existing columns using an expression"-->Edit expression button--> 
    • Category: Functions
    • Functions: Time series functions
    • Time series functions: Ago
    • Expression Builder: Ago(<<Measure>>, <<level>>,<<Number of periods>>)


    Here, In ago function, revenue is what we would like to check so in the first argument we should pass Revenue column, We want he data a month ago so the second argument gets month as level , third argument shows number of months you wanna go back. 
now click on ok-->ok.
  • Drag and drop this measurable column on to the presentation layer under Sales subject area as shown below.

  • Check in changes and save.
   4) Test the AGO measurable column
  • Go to Analytics--> Create a sample report using Year, Monthcode, Revenue, Month Ago. Go to results tab and you will see all the Revenues for a month ago as shown below:  

Note that the first value is blank for Month Ago since there is no data available before 199801.
This is how we calculate revenue 1 month ago.


5) Create ToDate measurable column

  • Similar to Month ago column, create YTD column to check revenue from starting of the year till date as shown below:  


  • Drag and drop this column to presentation layer on sales subject area. Check in changes and save. Add YTD column to the report and go to results tab we can see the result as shown below: 


6) Create Period rolling Measurable column
  • This is similar to ago and Todate functions. This example shows how to find out total revenue for last 3 months. Create new logical column under Orders face table called 3 months Period. the function periodrolling takes 3 arguments
    • First Argument: Measurable column to calculate : e.g. Revenue
    • Second Argument: Starting offset : we want to see data starting from last 3 months. for e.g. If it is December now then the revenue should be addition of revenues of previous 3 months , October and November  : E.g. -2.
    • Third Argument: Ending offset: We want to calculate revenue till date : e.g. 0 it represents current date.

  • Drag and drop this column on to presentation layer, check in changes and save.
  • Go to Analytics and drag and drop 3 months Period column on report. Go to results tab as shown below: 

This is how we can calculate the revenue starting from X point in time to Y point in time.


Monday, January 16, 2017

Presentation Variables


Presentation Variables:
These variables are used to capture user response with the help of prompts.

Demonstration:
  • Login to Analytics using administrator privileges-->new-->dashboard prompt-->sales-->add-->
 

save this dashboard prompt as "PV_PROMPT".

  • Now develop a report using region, district, revenue. Right click region-->filter-->add more options-->presentation variable-->variable expression '@{V_USER_SELECTION}'--> check the box of "convert this filter to SQL expression" -->ok. The filter will be added as shown below:
     

  • Save this report as PV_REPORT. Now let us create new dashboard. New--> Dashboard--> 
    • Name: PV_DASHBOARD
    • Location: Shared folders/sample folders/Dashboards
  • Drag and drop PV_PROMPT and PV_REPORT from catalog on to the blank dashboard. save and run. We will see dashboard prompt "Select user selection", type in Central and hit apply. It will show central region data. If we change case in Central then it will not show the data since it wont find any match.
  • We can write UPPER() on both sides to avoid case sensitivity.
  • This is how we make use of presentation variables to display the data in the report by capturing user response in a prompt.


Friday, January 13, 2017

Row-wise initialization: Variables Extension

Row-wise initialization:
It is used to retrieve and initialize a list of values to the non-system session variable.
For example:
If a user belongs to more than one region then to allow the user to see data from those regions, we will have to use Row-wise initialization to pass list of values of region (say east and central) to a non-system session variable instead of passing a single value.
Remember that a non-system session variable can only hold single value Either East or west or central but can not hold multiple values like an array , that is why we make use of Row-wise initialization.


Demonstration:

  • Suppose we have a table called USER_MULTI_GROUP which contains sales representative and their corresponding cities as shown below. Note that a Sales representative called Marc Belongs to 2 cities.


  • Open the repository in online mode, Import this table in physical layer. Let us set key on this table. Here City and salesrep column together can be a key. make these columns key column as follows:


  • Now create a new Business model called ROW_WISE_BM in BMM layer and drag and drop USE_MULTI_GROUP table from physical layer to BMM. Since we have only one table under ROW_WISE_BM, we must duplicate the table  USE_MULTI_GROUP and make it a fact table. Create a join between these two. Now drag and drop ROW_WISE_BM subject area in Presentation layer. Delete one table and keep only one as we don't require 2 tables in Presentation layer as shown below:


  • Now create User Marc and Group ROW_WISE_GROUP in console. Also create an application role called "ROW_WISE_ROLE" in enterprise manager. Assign ROW_WISE_GROUP to ROW_WISE_ROLE.(How to do this is written in Variables part 2 blog:System and Non-system Session variables)
 User:

Group:


Application role:


  • Synchronize this role in repository. Manage-->Identity-->Select BIRepository-->Action--> Synchronize Application roles. Go to Application Role tab and check if all Users like Marc, John are under it.
  • Now we need to create a new Initialization block as shown below:


  • ok. check in changes and save.
  • Now we need to create data filter. Go to manage-->identity-->highligh BIRepository-->Application role tab-->check out ROW_WISE_ROLE -->Permissions-->Data filter tab-->add-->select USER_MULTI_GROUP table --> select --> select the newly added line and edit expression-->add filter of USER_MGROUP instea of non-system session variable used in Variables part2 as shown below:


    click on ok-->ok--ok--> Check in changes and save.

  • Now log into Analytics using Administrator privileges, developer a sample report in ROW_WISE_BM using all columns. Save the report as "Row wise  data security report" as shown below:


  • Now login using MARC user, go to catalog and open the saved report "Row wise  data security report". MARC can see only his data for 2 cities since he belongs to more than 1 cities as shown below:


This is how we use row-wise initialization to pass multiple values to initialization block for retrieving more than one value unlike non-system session variable.

Wednesday, January 11, 2017

Variables part2: System and Non-system Session Variables

Session Variables:
A session is the time between which the user logs in and logs out. A user is said to be active in a session.
A session variable persist only within the active session. It receives a value when a user establishes the session.

Types of Session Variable:
1) System
2) Non-system


1) System session variable

  • These are predefined variables provided by OBIEE.
  • These variables are used by Oracle BI server for specific purpose such as Authenticating user.
  • Following is the list of those pre-defined variables:
    • USER
    • DISPLAY NAME
    • GROUP
USER

  • Create a sample report with Year and revenue.
  • Edit formula for Year. From the bottom select variables -->session -->Type in USER-->ok.
  • This will make VALUEOF(NQ_SESSION.USER) as shown below:


  • Here, NQ_SESSION refers to the current active session.
  • Now go to results tab we will see the user ADMINISTRATOR displayed in Year column as result of VALUEOF(NQ_SESSION.USER) as shown below:


Similarly, the DISPLAY NAME, GROUP, PERMISSIONS system variable can be used:

2) Non-system session variables

  • These are application specific customized variables which are created by Implementation team/Developers for specific purposes.
  • These can be used for data security in case we restrict the data for a particular user. For example, if a user is from East region then he should be able to see only East region's data and not West and Central.
  • Like Dynamic repository variables, Non-system session variables also require Initialization block.
Example:

  • Suppose, we have 2 Customers in the CUSTOMER table
    • Amerigo user who belongs to East region
    • Compound user who belongs to West region
  • Let us create these users in OBIEE using console. For now they are just values in the CUSTOMER table in column "Name". So let us create a user Amerigo.
  • Login to http://localhost:7001/console/login using Administrator privileges.
  • On left hand side, Under Domain structure-->Security realms -->myrealms-->go to Users and Groups tab-->Users sub-tab -->New-->
    • Name: Amerigo
    • Password: Amerigo
    • Confirm Password: Amerigo
  • Similarly, create another user called Compound. Keep in mind that these names should be exactly similar to what we have in Customer table since later while fetching the data from CUSTOMERS table the case must match.
  • We are able to create users in OBIEE because of (LDAP) Lightweight Direct Access Protocol. It is third party tool integrated with OBIEE console and is useful to verify the security related objects.
  • Now we need to create a Group for the user say Customer group since we are creating logins for 2 customers. Go to GROUP sub-tab-->New-->
    • Name: BICustomers
    • Description: group of customer
    • Provider: Default
  • Now we need to assign this Group to both Amerigo and Compound User. To do this, go to the USERS sub-tab-->click on Amerigo-->go to groups sub-tab--->select BICustomers from the list of groups-->Save. Similarly, assign BICustomers to Compound user as well as shown below:


  • In next  step , we will create an application role through EM Enterprise Manager. Then we will assign the BICustomers Group to this application role. To create this application role, we need to perform following steps. 
  • Go to web browser and login to http://localhost:7001/em/login using Administrator privilege --> expand Business Intelligence and select core applications as shown below:


  • Go to Security tab-->under Application Policies and Roles , select Configure & Manage Application Roles-->create -->
    • Role Name: BICustomer
    • Display name:BICustomer
    • Description:
  • Now under Members section, click on Add green plus sign.-->in search section type in BICustomers and hit enter.-->In the list BICustomers group will appear. ---> select BICustomers -->ok. This is how we create new application role and assign a user group to it.
  • Next we need to synchronize the application role and group created in Enterprise Manager in to the repository. This is to inform the Repository that 2 new users, 1 group and 1 application role was created in EM.
  • Open the repository in online mode-->Manage-->Identity-->Action -->synchronize Application Roles . Once we do this, we can now see BICustomer under Application roles tab as shown below:


  • Now, any new user getting created in Console needs to access data from the database for which they require dedicated connection pool in Repository's Physical layer. To do this, go to physical layer--> Orcl-->new object--> Connection Pool--> fill in details as follows:

  • Now, we need to create Initialization Block and assign the value to a non-system session variable. To do this, go to Manage--> Variables-->Action--->new-->Session--->Variable -->fill in as shown below:
     

  • Now, in the Initialization Block section -->New...--> fill in as shpown below
    • Name:IB_USER_REGION
    • Edit data source: SELECT REGION FROM CUSTOMERS WHERE NAME=':USER' Above query fetches the region name where the current user belongs.
    • Connection pool: IB_SESSION (since we created the dedicated connection pool for new users)
    • ok -->ok.


  • Check in changes and save.
  • After this, we need to add data filter to restrict the data. go to manage--> identity -->on left hand side select BI Repository--> Application roles -->BICustomer --> check out --> data filter tab-->add --> click on Sales and hit select button --> a new line will be added--> select the newly created line--> edit expression button beside Add button--> assign filter using V_USER_REGION variable as shown below:
 

By doing this, we are filtering the data for BICustomers. So whenever a user belonging to BICustomer Application role logs in, be it Amerigo or Compound, it will have  a data filter on the region field. This region will get its value from Non-system session variable V_USER_REGION. this variable gets its value from IB_USER_REGION initialization block. 
  • Check in changes and save.
  • At this point, we have completed all changes in Repository.
  • Now its time to login into analytics using Administrator user and reload server metadata. Create a report using Region, district, revenue column, go to results tab and we will see all the regions data since the administrator is allowed to view the data from all the regions. Now save this report as "Data Security Report" under shared folder in web catalog. Sign out.
  • Now login using Amerigo user (Please remember that we must enter username exactly as in the table Customers, it is case sensitive, if we miss the case, we may be able to log in but the data in the report will not be displayed. If you want the username case-insensitive then just add upper on both sides of the select query written in IB_USER_REGION like "select region from customers where upper(name)= upper(':USER') ).                                                                  Open the Saved "Data Security Report" . Here, Amerigo user can see only East region data since it belongs to only east region. Similarly, if we login using Compound data we will see West region data only.
  • This is how we achieve data security using Non-system session variables by providing limited access to the users.


Tuesday, January 10, 2017

Variables Part1: Static and Dynamic Repository variable

Variables are used to store a value. They contain value in the memory that is used by Oracle BI server during its processing.

Types of Variables in OBIEE:

1) Repository Variables
2) Session Variables
3) Presentation Variables
4) Request Variables

Repository and session variables can be used in both web catalog (Analytics) and Repository. These are defined inside the Administration tool under variable manager.
However, Presentation and session variables can be used in  web catalog (Analytics) only.

1) Repository Variables

  • Open the repository in Online mode
  • Sub-types:
    1. Static
    2. Dynamic
  1. Static Variables
  •               Using the Static variable at catalog (Analytics) level
  These variable are used when we want to pass a constant value multiple times at different places. Open the repository in online mode --> Manage --> Variables... ---> Repository -->Variables -->Static ---> Rigth click on blank section-->New static variable -->

Check in changes & save.
Go to analytics, reload server metadata.

Test the static variable:
Go to analytics-->New-->Analysis --> sales--> select Year, region, revenue.
Add filter on Year -->Add more options-->Repository variable --> Type : "V_CURR_YEAR" in repository variable textbox-->ok.
Go to results tab --> the data will be displayed for only year 1999 as per the value of static variable in the repository.
                      
  •               Using the Static variable at repository level
In BMM layer , the customer data comes from D1_CUST_PART1 and D1_CUST_PART2 tables.
Part1 table has all customers whose first name is less than 'N' and Part2 table has all customers whose names is greater than or equal to 'N'. 
This 'N' may change in future. instead of hard coding the value as 'N' we will use  static variable whose value is 'N'.
Now create a static variable as shown below:
Now go to BMM, double click on D1_CUST_PART1 in sales-->Content tab--> replace 'N' by variable V_VAR.
Do the same for D1_CUST_PART2 table.
Check in changes & save.

Go to analytics-->Develop a new report with Name & Revenue columns.
Add filter on Name column -->Value less than 'K'.
Go to results tab--> the data is fetched from D1_CUST_PART1 since K is less than 'N'.

2. Dynamic Variables
Dynamic variable get their values from initialization blocks. This initialization block is nothing but a variable that holds results of a SQL query and passes it to the dynamic variable. The Oracle BI server has to refreshed in order to assign value to Initialization block.

To create a dynamic variable do the following:

Go to Manage--> Variables...-->Repository-->Variables-->Dynamic
Now right click on the blank page-->New dynamic variable-->
Name: V_PF; 
Initialization Block: Click on New... button
(Repository Variable initialization Block window appears)
Name: IB_PV
Default Initializer: '&' (To avoid errors in report when the SQL query fetches null values)
Now click on Edit data source:
Data source type: Database as shown below
Default Initialization string: select min(substr(name,1,1)) from D1_CUST_PART2
(This fetches first letter of name in CUST_PART2 table i.e.'N')
Connection pool: Orcl.connection pool
Upon clicking "Test" the value of  'N' for V_PF.

click ok and exit from Repository Variable initialization Block window.
Click ok again. 
From the drop down select "IB_PV" as Initialization block.
Check in changes and save.

Assigning dynamic variable to dimension tables:
Now that we have created the V_PF dynamic variable, we will assign this to D1_CUST_PART1 table as shown below:

Do the same for D1_CUST_PART2 as shown below:


Now, go to Analytics,create a new report with a filter as follows:

Go to results tab and you will see the data with name only starting from Letter 'A' and 'B'. Now, click on Administration--> Under session management click on Manage sessions-->Go to the recent query generated-->View log-->
 The query generated shows us that the data was fetched from D1_CUST_PART1.
This is how the dynamic variables are used.
We can also use Dynamic repository variables in filter as shown below: