Partitioning:
Splitting of one large table into small portions is called as partitioning.
Fragments:
The resultant of the partition is called as fragment.
Say, we have a huge D1_CUSTOMERS2 table with a lot of data. We would like to partition this table based of the customer names. All the customers whose name start from A-N will be in one partition and rest of the customers whose name start with O-Z will fall under 2nd partition.
 For that, we will be creating 2 different tables from this huge table.
1) CREATE TABLE D1_CUST_PART1 AS SELECT * FROM D1_CUSTOMERS2 WHERE SUBSTR(NAME,1,1) <N;
2) CREATE TABLE D1_CUST_PART2 AS SELECT * FROM D1_CUSTOMERS2 WHERE SUBSTR(NAME,1,1) >=N;
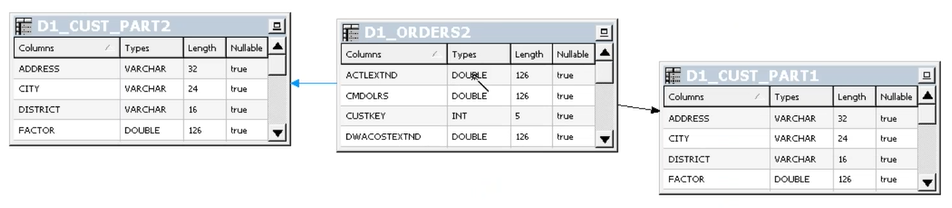
Now, Open the repository in online mode-->Physical layer-->connection pool---> right click and select "Import Metadata" --> Select these 2 tables D1_CUST_PART1 ,D1_CUST_PART2.
Now select these 3 tables and highlight them :D1_CUST_PART1 ,D1_CUST_PART2,D1_ORDER2 and right click-->Phisical diagram ---> Join these tables on Newkey=Custkey as shown below:

Check in changes and save it.
Now we want to work on BMM layer.
Previously, all the customers data was comming from Customers dimension table but nw it has to come from partitioned tables. thus need need to map all columns of both partition tables to customers table in BMM layer by dragging and dropping them from physical layer to BMM layer for every column.
Now that we have mapped partitioned tables, we do not need D1_CUSTOMERS table in BMM layer anymore, so we will disable this table from logical table source.

Double click the logical source table D1_CUSTOMERS2 and go to the General tab and click the check box of disabled, if this table is needed for future use then just un-check the box:

Managing the keys:
We can only have one key per dimension table. as a result of mapping 2 partition tables to BMM layer, 2 keys are added to the keys section of Customers table as shown below:
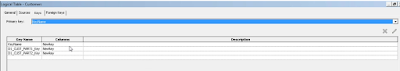
We need to delete these 2 newly created keys and keep the old one.
Until now we have just imported and mapped the partitioned tables. Now we need to fragment them.
to do this go to D1_CUST_PART1 logical table source-->Content tab --->Fragmentation content -->Edit formula button as shown below:
 we edit the formula saying name<N.
Also select the check box "This source should be combined with other sources at this level". So that we can combine results of this table with other part2 table when entire data is fetched. Also check "Select distinct values" check box and define the content level as customers.
 Similarly, set Fragmentation Content for D1_CUST_PART2, select the check box "This source should be combined with other sources at this level". So that we can combine results of this table with other part1 table when entire data is fetched. Also check "Select distinct values" check box and define the content level as customers..
Now, just verify once the log level is 2 and delete cache (Manage -->cache--->right click and select purge).
Check in changes and save.
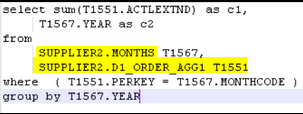
Now, login to Analytics with Administrator user and reload server metadata. Create a new report -->Select Name, Revenue-->Add a filter on Name where < C -->Results tab -->Administration-->under Session management click manage sessions --> scroll down and click on view log of our report --> this will show that detailed physical level query. since the data we requested is in D1_CUST_PART1 table, the query is fetching data from the same table.

If we have name filter <V then it would have fetched the data from D1_CUST_PART2 table.
If we put no filter at all then the data will be fetched from Union of both the tables.
This is how we can make the report to run from a particular partition instead of having to go through the entire table. This improves the performance a lot.
Splitting of one large table into small portions is called as partitioning.
Fragments:
The resultant of the partition is called as fragment.
Say, we have a huge D1_CUSTOMERS2 table with a lot of data. We would like to partition this table based of the customer names. All the customers whose name start from A-N will be in one partition and rest of the customers whose name start with O-Z will fall under 2nd partition.

1) CREATE TABLE D1_CUST_PART1 AS SELECT * FROM D1_CUSTOMERS2 WHERE SUBSTR(NAME,1,1) <N;
2) CREATE TABLE D1_CUST_PART2 AS SELECT * FROM D1_CUSTOMERS2 WHERE SUBSTR(NAME,1,1) >=N;
Now, Open the repository in online mode-->Physical layer-->connection pool---> right click and select "Import Metadata" --> Select these 2 tables D1_CUST_PART1 ,D1_CUST_PART2.
Now select these 3 tables and highlight them :D1_CUST_PART1 ,D1_CUST_PART2,D1_ORDER2 and right click-->Phisical diagram ---> Join these tables on Newkey=Custkey as shown below:
Check in changes and save it.
Now we want to work on BMM layer.
Previously, all the customers data was comming from Customers dimension table but nw it has to come from partitioned tables. thus need need to map all columns of both partition tables to customers table in BMM layer by dragging and dropping them from physical layer to BMM layer for every column.
Now that we have mapped partitioned tables, we do not need D1_CUSTOMERS table in BMM layer anymore, so we will disable this table from logical table source.

Double click the logical source table D1_CUSTOMERS2 and go to the General tab and click the check box of disabled, if this table is needed for future use then just un-check the box:

Managing the keys:
We can only have one key per dimension table. as a result of mapping 2 partition tables to BMM layer, 2 keys are added to the keys section of Customers table as shown below:
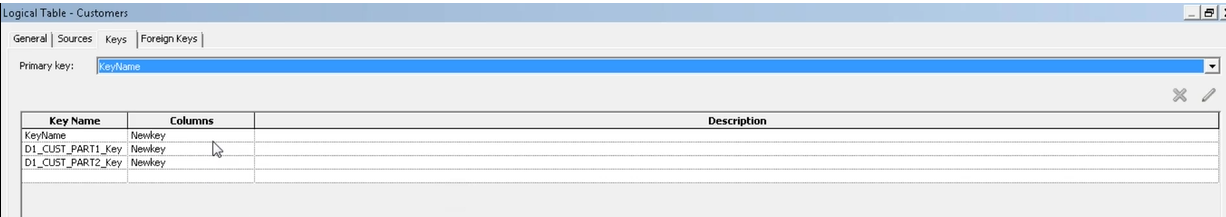
We need to delete these 2 newly created keys and keep the old one.
Until now we have just imported and mapped the partitioned tables. Now we need to fragment them.
to do this go to D1_CUST_PART1 logical table source-->Content tab --->Fragmentation content -->Edit formula button as shown below:

Also select the check box "This source should be combined with other sources at this level". So that we can combine results of this table with other part2 table when entire data is fetched. Also check "Select distinct values" check box and define the content level as customers.

Now, just verify once the log level is 2 and delete cache (Manage -->cache--->right click and select purge).
Check in changes and save.
Now, login to Analytics with Administrator user and reload server metadata. Create a new report -->Select Name, Revenue-->Add a filter on Name where < C -->Results tab -->Administration-->under Session management click manage sessions --> scroll down and click on view log of our report --> this will show that detailed physical level query. since the data we requested is in D1_CUST_PART1 table, the query is fetching data from the same table.

If we have name filter <V then it would have fetched the data from D1_CUST_PART2 table.
If we put no filter at all then the data will be fetched from Union of both the tables.
This is how we can make the report to run from a particular partition instead of having to go through the entire table. This improves the performance a lot.