The data in the transactional database is very detailed.
For e.g. For a year 2016, the revenue is stored for every day of a month and quarter as shown below. So to retrieve the revenue for the year 2016, we may require 365 seconds (Number of days in a year, considering 1 record fetch takes 1 second). If we want to sum them all then we may take another 365 seconds. So, the total time taken will be 730 seconds =12 mins. This will cause the performance to go down if the database takes 12 mins to fetch the result.

So to avoid this, we will aggregate the data and store in a table in OLAP. Something like this:

If we query this OLAP table then number of seconds to retrieve data for year 2016 will be 4 seconds as there as 4 rows, to add them up it may take another 4 seconds, it means the total of 8 seconds.
Thus, we see that to achieve the same result in different databases we take different amount of time. Transactional database takes 12 mins and OLAP takes 8 seconds to retrieve the total revenue of 2016.
Thus, storing an aggregate table in OLAP makes it faster than a detailed table in transactional database.
Hence, the aggregates are used to summarize the data for quick data retrieval since data has been pre-calculated.
For the purpose of demonstration, create 3 aggregate tables in OLAP from Orders, customers and calendar table.The data in Orders, customers and calendar table should be aggregated to Month level.
Now, import these small aggregated tables into connection pool in repository. Make sure to open repository in online mode.
Following are the aggregate tables:
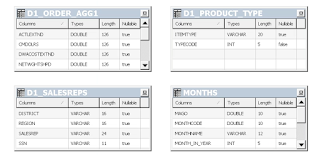
Join these tables:
In physical layer, ctrl + select all 4 tables and right click physical diagram.
D1_ORDERS_AGG1.typecode =D1_PRODUCT_TYPE.typekey
D1_ORDERS_AGG1.salesrep=D1.SALESREP.repkey
D1_ORDERS_AGG1.monthcode= D1.MONTHS.perkey
After the joins the tables will look like this:

Check in the changes. save.
Now, the columns in these 4 tables should be mapped to corresponding columns in BMM layer.
This is how we map them:
First we drag and drop "District" column from D1_SALESREP table to Customers table in BMM. As soon as we drag and drop this column on to the "District" column of CUSTOMER table, new source table "D1_SALESREP" is added to sources folder in BMM layer as shown below.

Similarly, drag and drop Region column,Salesrep column.
Also, Drag and drop monthcode column in physical layer to monthcode column in BMM layer, this will add D1_MONTHS table in sources folder of Periods table in BMM layer.
Multiple key columns problem:
By mapping physical columns to logical columns, we ended up having two key columns for each table in BMM layer which clearly is an error. thus we must select each table in BMM , go to the keys tab and select only one column as a key and delete the rest of the columns as shown below:

Defining content level:
Now, to perform any aggregate operation on these newly mapped columns, we need to define content level for the BMM layer dimension tables(Customers, Periods, Products) to its lowest level. if we do not do this then the data will be generated from detailed tables from transactional database instead of aggregated high level tables in OLAP.
Thus, to avoid this we need to set the content level.
For e.g. the lowest level of information that D1_Month table has is "Month", so we will map Periods logical dimension table to content level as Month as shown below:

Similarly, set content level for Product dimension as itemtype, for Customers dimension as salesrep.
Also set content level for fact table Orders as follows:

Please note that Content level set for individual dimension table(when we double click and open a dimension table in BMM layer and got to the content tab) should be the same as content level set for all dimension tables in Fact table (when we double click the fact table in BMM layer and got to the content tab).
For e.g. in content level for Product dimension is "Specific Desc" column then in fact table content also it should be "Specific Desc" only for Product dimension.No other column can be specified, or else it will throw an error while check in changes.
Check in the changes and save.
Setting log level:
Make sure that log level is set to "2" to see the detailed SQL generated behind the report by Administrator user. to set this level do the following:
Manage-->Identity --> select Administrator user --->User tab --> Log level=2 -->Ok.
save.
Go to analytics --> reload server metadata.-->New--->analysis --->sales ---> select Year and revenue --> Go to results tab ---> administration --> under session management -->manage sessions --> scroll down and view log ---> detailed SQL can be seen.

it is clear that the data was fetched from high level aggregated OLAP tables instead of original transactional database tables. This is because we are fetching year and its corresponding revenue, so we are asking it to fetch total revenue of each year. Since our OLAP data is aggregated to the lowest level month, until we select Year, Quarter, month and revenue , we will get the data from high level aggregated OLAP tables.
But if we select "day in a month" column to be displayed along with its revenue, we know that the day level data is very detailed and OLAP tables do not have it, thus the sql generated will fetch this level of detail from the transcactional database tables instead of OLAP tables.
Thus the SQL that gets generated will show original table names instead of OLAP tables as follows:

For e.g. For a year 2016, the revenue is stored for every day of a month and quarter as shown below. So to retrieve the revenue for the year 2016, we may require 365 seconds (Number of days in a year, considering 1 record fetch takes 1 second). If we want to sum them all then we may take another 365 seconds. So, the total time taken will be 730 seconds =12 mins. This will cause the performance to go down if the database takes 12 mins to fetch the result.
So to avoid this, we will aggregate the data and store in a table in OLAP. Something like this:
Thus, we see that to achieve the same result in different databases we take different amount of time. Transactional database takes 12 mins and OLAP takes 8 seconds to retrieve the total revenue of 2016.
Thus, storing an aggregate table in OLAP makes it faster than a detailed table in transactional database.
Hence, the aggregates are used to summarize the data for quick data retrieval since data has been pre-calculated.
For the purpose of demonstration, create 3 aggregate tables in OLAP from Orders, customers and calendar table.The data in Orders, customers and calendar table should be aggregated to Month level.
Now, import these small aggregated tables into connection pool in repository. Make sure to open repository in online mode.
Following are the aggregate tables:

Join these tables:
In physical layer, ctrl + select all 4 tables and right click physical diagram.
D1_ORDERS_AGG1.typecode =D1_PRODUCT_TYPE.typekey
D1_ORDERS_AGG1.salesrep=D1.SALESREP.repkey
D1_ORDERS_AGG1.monthcode= D1.MONTHS.perkey
After the joins the tables will look like this:

Check in the changes. save.
Now, the columns in these 4 tables should be mapped to corresponding columns in BMM layer.
This is how we map them:
First we drag and drop "District" column from D1_SALESREP table to Customers table in BMM. As soon as we drag and drop this column on to the "District" column of CUSTOMER table, new source table "D1_SALESREP" is added to sources folder in BMM layer as shown below.

Similarly, drag and drop Region column,Salesrep column.
Also, Drag and drop monthcode column in physical layer to monthcode column in BMM layer, this will add D1_MONTHS table in sources folder of Periods table in BMM layer.
Multiple key columns problem:
By mapping physical columns to logical columns, we ended up having two key columns for each table in BMM layer which clearly is an error. thus we must select each table in BMM , go to the keys tab and select only one column as a key and delete the rest of the columns as shown below:

Defining content level:
Now, to perform any aggregate operation on these newly mapped columns, we need to define content level for the BMM layer dimension tables(Customers, Periods, Products) to its lowest level. if we do not do this then the data will be generated from detailed tables from transactional database instead of aggregated high level tables in OLAP.
Thus, to avoid this we need to set the content level.
For e.g. the lowest level of information that D1_Month table has is "Month", so we will map Periods logical dimension table to content level as Month as shown below:

Similarly, set content level for Product dimension as itemtype, for Customers dimension as salesrep.
Also set content level for fact table Orders as follows:

Please note that Content level set for individual dimension table(when we double click and open a dimension table in BMM layer and got to the content tab) should be the same as content level set for all dimension tables in Fact table (when we double click the fact table in BMM layer and got to the content tab).
For e.g. in content level for Product dimension is "Specific Desc" column then in fact table content also it should be "Specific Desc" only for Product dimension.No other column can be specified, or else it will throw an error while check in changes.
Check in the changes and save.
Setting log level:
Make sure that log level is set to "2" to see the detailed SQL generated behind the report by Administrator user. to set this level do the following:
Manage-->Identity --> select Administrator user --->User tab --> Log level=2 -->Ok.
save.
Go to analytics --> reload server metadata.-->New--->analysis --->sales ---> select Year and revenue --> Go to results tab ---> administration --> under session management -->manage sessions --> scroll down and view log ---> detailed SQL can be seen.
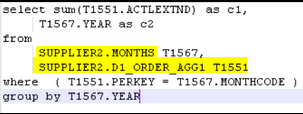
it is clear that the data was fetched from high level aggregated OLAP tables instead of original transactional database tables. This is because we are fetching year and its corresponding revenue, so we are asking it to fetch total revenue of each year. Since our OLAP data is aggregated to the lowest level month, until we select Year, Quarter, month and revenue , we will get the data from high level aggregated OLAP tables.
But if we select "day in a month" column to be displayed along with its revenue, we know that the day level data is very detailed and OLAP tables do not have it, thus the sql generated will fetch this level of detail from the transcactional database tables instead of OLAP tables.
Thus the SQL that gets generated will show original table names instead of OLAP tables as follows:

No comments:
Post a Comment